Unreal PBR Calibration Plugin
Working on an unreal calibration plugin that can validate PBR values on screen.
Extending From Last Post
In my last post, I added a custom render pass into Unreal’s render pipeline with a custom global shader through an Unreal plugin:
This time, I extended the functionality of my plugin, to let it become a PBR calibration plugin that can be used in editor to calibrate the albedo (brightness for dielectric materials\metallic materials), saturation, roughness range, metalness value.
When I’m working in the current PBR pipeline project, the huge amount of assets making the calibration very difficult, and not everyone reads the documentation or follows the documentation, besides it’s not easy to tell whether each gbuffer channel is in valid range or not by just eyeballing.
It’s necessary to provide with a visualization tool that easily indicating which pixel is out of range. This calibration workflow should start from DCC (Substance Painter, Substance Designer) to engine. I’ve done some calibration within Substance Painter shader to give corresponding warning colors when PBR values are out of range, this time I’d like to try to use the plugin I was working on to make a PBR calibration tool to visualize the invalid PBR values showing in the editor view port.
Add a New Buffer to Save GBuffer Data
Diffuse color, roughness and metallic are all Gbuffer data, to get and compare the pixels from each, I need to pass them into an RDG pass using SHADER_PARAMETER_RDG_UNIFORM_BUFFER so that the shader can grab and use them:
    // ----------CTGlobalShader.h-------------
    #pragma once

    #include "GlobalShader.h"
    #include "Runtime/Renderer/Private/ScreenPass.h"

    // Add this line:
    DECLARE_UNIFORM_BUFFER_STRUCT(FSceneTextureUniformParameters, RENDERER_API);

    class FCTGlobalShaderPS : public FGlobalShader {
    public:
        DECLARE_SHADER_TYPE(FCTGlobalShaderPS, Global,);
        SHADER_USE_PARAMETER_STRUCT(FCTGlobalShaderPS, FGlobalShader);

        BEGIN_SHADER_PARAMETER_STRUCT(FParameters, )
            SHADER_PARAMETER(FScreenTransform, SvPositionToInputTextureUV)
            // Add this line:
            SHADER_PARAMETER_RDG_UNIFORM_BUFFER(FSceneTextureUniformParameters, SceneTextures)
            SHADER_PARAMETER_RDG_TEXTURE(Texture2D, InputTexture)
            SHADER_PARAMETER_SAMPLER(SamplerState, InputSampler)
            SHADER_PARAMETER(FLinearColor, InputColor)
            RENDER_TARGET_BINDING_SLOTS()
        END_SHADER_PARAMETER_STRUCT()
    };
Correspondingly, in CTSceneViewExtension.cpp, I need to grab SceneTextures that has gbuffer data to the shader.
    // ----------CTSceneViewExtension.cpp-------------
    ...

    void FCTSceneViewExtension::PrePostProcessPass_RenderThread(FRDGBuilder& GraphBuilder, const FSceneView& View, const FPostProcessingInputs& Inputs)
    {	....
        // Add this line:
        CTGlobalShaderParameters->SceneTextures = Inputs.SceneTextures; // *1

        CTGlobalShaderParameters->InputTexture = SceneColor.Texture;
        CTGlobalShaderParameters->ViewportUV = FVector2f(FScreenPassTextureViewport(SceneColor).Rect.Width(), FScreenPassTextureViewport(SceneColor).Rect.Height());// (unsigned int)FScreenTransform::ETextureBasis::ViewportUV;
        ...
    }
*1 Inputs.SceneTextures is from FPostProcessingInputs:
1
2
struct FPostProcessingInputs{ TRDGUniformBufferRef<FSceneTextureUniformParameters> SceneTextures = nullptr;
... }
FSceneTextureUniformParameters is a uniform buffer containing common scene textures used by materials or global shaders. In SceneTexturesConfig.h file it defines from scene color to depth, gbuffer, ssao, custom depth, etc.
Use GBuffer Data in the Global Shader
Now, in the .usf shader file, I can start to use the GBuffer data from the SceneTextures:
    // ----------CTGlobalShader.usf-------------
    #include "/Engine/Public/Platform.ush"  //need to include this otherwise compilation error: cant found common.ush
    #include "/Engine/Private/Common.ush"
    #include "/Engine/Private/ScreenPass.ush"
    // Add this line:
    #include "/Engine/Private/DeferredShadingCommon.ush"


    // Shader Parameters
    Texture2D InputTexture;
    SamplerState InputSampler;
    float4 InputColor;
    FScreenTransform SvPositionToInputTextureUV;

    // Fragment Shader
    void MainPS(
        float4 SvPosition : SV_POSITION,
        out float4 OutColor : SV_Target0)
    {
        ....
        // Add this line:
        FGBufferData GBufferData = GetGBufferData(UV); // *1
        ...
    }
*1 GetGBufferData() is defined in /Engine/Private/DeferredShadingCommon.ush file, it contains:
    // all values that are output by the forward rendering pass
    struct FGBufferData
    {
        // normalized
        half3 WorldNormal;
        // normalized, only valid if HAS_ANISOTROPY_MASK in SelectiveOutputMask
        half3 WorldTangent;
        // 0..1 (derived from BaseColor, Metalness, Specular)
        half3 DiffuseColor;
        // 0..1 (derived from BaseColor, Metalness, Specular)
        half3 SpecularColor;
        // 0..1, white for SHADINGMODELID_SUBSURFACE_PROFILE and SHADINGMODELID_EYE (apply BaseColor after scattering is more correct and less blurry)
        half3 BaseColor;
        // 0..1
        half Metallic;
        // 0..1
        half Specular;
        // 0..1
        half4 CustomData;
        // AO utility value
        half GenericAO;
        // Indirect irradiance luma
        half IndirectIrradiance;
        // Static shadow factors for channels assigned by Lightmass
        // Lights using static shadowing will pick up the appropriate channel in their deferred pass
        half4 PrecomputedShadowFactors;
        // 0..1
        half Roughness;
        // -1..1, only valid if only valid if HAS_ANISOTROPY_MASK in SelectiveOutputMask
        ....
        ....
};
Implement the Pixel Comparison
Then I can start to work on the calibration logic in my .usf file.
Basically the logic is, for example “if diffuseColor’s brightness < x.xf, then debugPixels = red color”, so that the original pixels will be replaced by the debug pixels, to indicate this pixel is problematic:
    // ----------CTGlobalShader.usf-------------

    ...
    FGBufferData GBufferData = GetGBufferData(UV);

    float3 debugPixels = float3(1.0f, 1.0f, 1.0f);
    float luminance = Luminance(GBufferData.DiffuseColor);
    float saturation = LinearRGB_2_HSV(GBufferData.DiffuseColor).y;
    float flagPixels = 0.0f;

    if(InputFlag == 0.0f) //Albedo
    {
        flagPixels = 0.0f;
        if(GBufferData.Metallic < 0.2f) //If Dielectric Materials
        {
            if(luminance < 0.016988f) // too dark - red
            {
                flagPixels += 1.0f;
                debugPixels = float3(1.0, 0.0, 0.0);
            }
            if(luminance > 0.875137f) // too bright - yellow
            {
                flagPixels = 1.0f;
                debugPixels = float3(1.0, 1.0, 0.0);
            }
        }
        else
        {
            if(luminance < 0.33446f)
            {
                flagPixels += 1.0f; // too dark metal - blue
                debugPixels = float3(0.0, 0.0, 1.0);
            }
        }

        if(saturation > 0.8f)
        {
            flagPixels += 1.0f; // too saturated - magenta
            debugPixels = float3(1.0, 0.0, 1.0);
        }
    }

    if(InputFlag == 1.0f) //Roughness
    {
        flagPixels = 0.0f;
        if(GBufferData.Roughness < 0.098f) // too gloss - red
        {
            flagPixels = 1.0f;
            debugPixels = float3(1.0f, 0.0f, 0.0f);
        }
        if(GBufferData.Roughness > 0.955f) // too rough - yellow
        {
            flagPixels += 1.0f;
            debugPixels = float3(1.0f, 1.0f, 0.0f);
        }
    }

    if(InputFlag == 2.0f) //Metallic
    {
        flagPixels = 0.0f;
        if (GBufferData.Metallic > 0.2f && GBufferData.Metallic < 0.8f) // gray scale metallic - red
        {
            flagPixels = 1.0f;
            debugPixels = float3(1.0, 0.0, 0.0);
        }
    }
    flagPixels = saturate(flagPixels);
    OutColor = lerp(Texture2DSample(InputTexture, InputSampler, UV), float4(debugPixels.xyz, 1.0f), flagPixels);
    ...
Create an Editor Panel
In my last post, what I did to let the plugin work and add the render thread was I added an Actor, and after BeginPlay(), the render thread will be activated.
Now because it’s a debug tool, I want it to be called in editor from several buttons.
I haven’t ever wrote any UI in C++ in Unreal, but I remembered in plugin template there’s one can add the plugin into the menu:

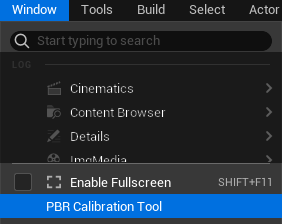
Codes there can bring you a plugin button and a dock tab:

In the .cpp file it generated, there’s a function named onSpawnPluginTab() is where you can add your own Slate UI into the empty dock tab window.
Create Buttons and Call functions
So I added four buttons for my tool, and linked my FSceneViewExtensions with buttons:
// ------------- CTLib.cpp -------------
TSharedRef<SDockTab> FCTLibModule::OnSpawnPluginTab(const FSpawnTabArgs& SpawnTabArgs)
    {
	FText AlbedoButtonText = FText::FromString(TEXT("Diffuse Color"));
	FText MetallicButtonText = FText::FromString(TEXT("Metallic"));
	FText RoughnessButtonText = FText::FromString(TEXT("Roughness"));

	return SNew(SDockTab)
		.TabRole(ETabRole::NomadTab)
		.ShouldAutosize(true)
		[
			SNew(SBox)
				.Padding(FMargin(20.f, 5.f))
				[
					// Put your tab content here!
					SNew(SVerticalBox)
						+ SVerticalBox::Slot()
						.HAlign(HAlign_Left)
						.VAlign(VAlign_Fill)
						.AutoHeight()

						.Padding(2.f, 2.f)
						[	SNew(STextBlock)
								.Text(FText::FromString(TEXT("PBR Value Calibration Tool: Select each channel to calibrate PBR values in you level. Hoover on each button to see descriptions")))
								.AutoWrapText(true)
						]
						+ SVerticalBox::Slot()
						.HAlign(HAlign_Left)
						.VAlign(VAlign_Fill)
						.MaxHeight(24.f)
						.Padding(2.f, 2.f)
						[
							SNew(SButton)
								.Text(AlbedoButtonText)
								.OnClicked(FOnClicked::CreateRaw(this, &FCTLibModule::StartCalibration_Albedo))
								.ToolTipText(FText::FromString(TEXT("RED:Diffuse Color is too dark for dielectric materials; YELLOW:Diffuse Color is too bright for dielectric materials; BLUE:Diffuse Color is too dark for metal materials; MAGENTA:Diffuse Color is too saturated")))
						]
						+ SVerticalBox::Slot()
						.HAlign(HAlign_Left)
						.VAlign(VAlign_Fill)
						.MaxHeight(24.f)
						.Padding(2.f, 2.f)
						[
							SNew(SButton)
								.Text(RoughnessButtonText)
								.OnClicked(FOnClicked::CreateRaw(this, &FCTLibModule::StartCalibration_Roughness))
								.ToolTipText(FText::FromString(TEXT("RED:Roughness is lower than 0.098f; YELLOW:Roughness is higher than 0.955f")))
						]
						+ SVerticalBox::Slot()
						.HAlign(HAlign_Left)
						.VAlign(VAlign_Fill)
						.Padding(2.f, 2.f)
						.MaxHeight(24.f)
						[
							SNew(SButton)
								.Text(MetallicButtonText)
								.OnClicked(FOnClicked::CreateRaw(this, &FCTLibModule::StartCalibration_Metalness))
								.ToolTipText(FText::FromString(TEXT("RED:Metalness has a grayscale value (Invalid Range: 0.039f ~ 0.9216f)")))
						]
						+ SVerticalBox::Slot()
						.HAlign(HAlign_Left)
						.VAlign(VAlign_Fill)
						.Padding(2.f, 2.f)
						.MaxHeight(24.f)
						[
							SNew(SButton)
								.Text(FText::FromString(TEXT("Remove Caliboration")))
								.OnClicked(FOnClicked::CreateRaw(this, &FCTLibModule::RemoveCalibration))
						]
				]

		];
    }
Under each SButton, .OnClicked() function is the one can call a function after cliked the button.
To be noticed, I can’t write OnClicked(this, &FCTLibModule::MyFunction) directly, instead I have to use OnClicked(FOnClicked::CreateRaw(this, &FCTLibModule::MyFunction)) , because FCTLibModule derived from IModuleInterface, it’s not a shared pointer, so have to specify the method to bind for OnCliked.
For functions that called by the button, it needs to use FReply class. This is its description:
* A Reply is something that a Slate event returns to the system to notify it about certain aspect of how an event was handled.
* For example, a widget may handle an OnMouseDown event by asking the system to give mouse capture to a specific Widget.
* To do this, return FReply::CaptureMouse( NewMouseCapture ).
    FReply FCTLibModule::StartCalibration_Albedo()
    {
        FCTLibModule::RemoveCalibration();
        if (CTSceneViewExtension == nullptr)
        {
            CTSceneViewExtension = FSceneViewExtensions::NewExtension<FCTSceneViewExtension>(FLinearColor::Red, 0.0f);
        }
        return FReply::Handled();
    }
Through each fuction StartCalibration_Roughness, StartCalibration_Albedo, StartCalibration_Metallic, I alse passed a flag into the shader, so that my shader knows in what channel is debugging right now.
The Final Look
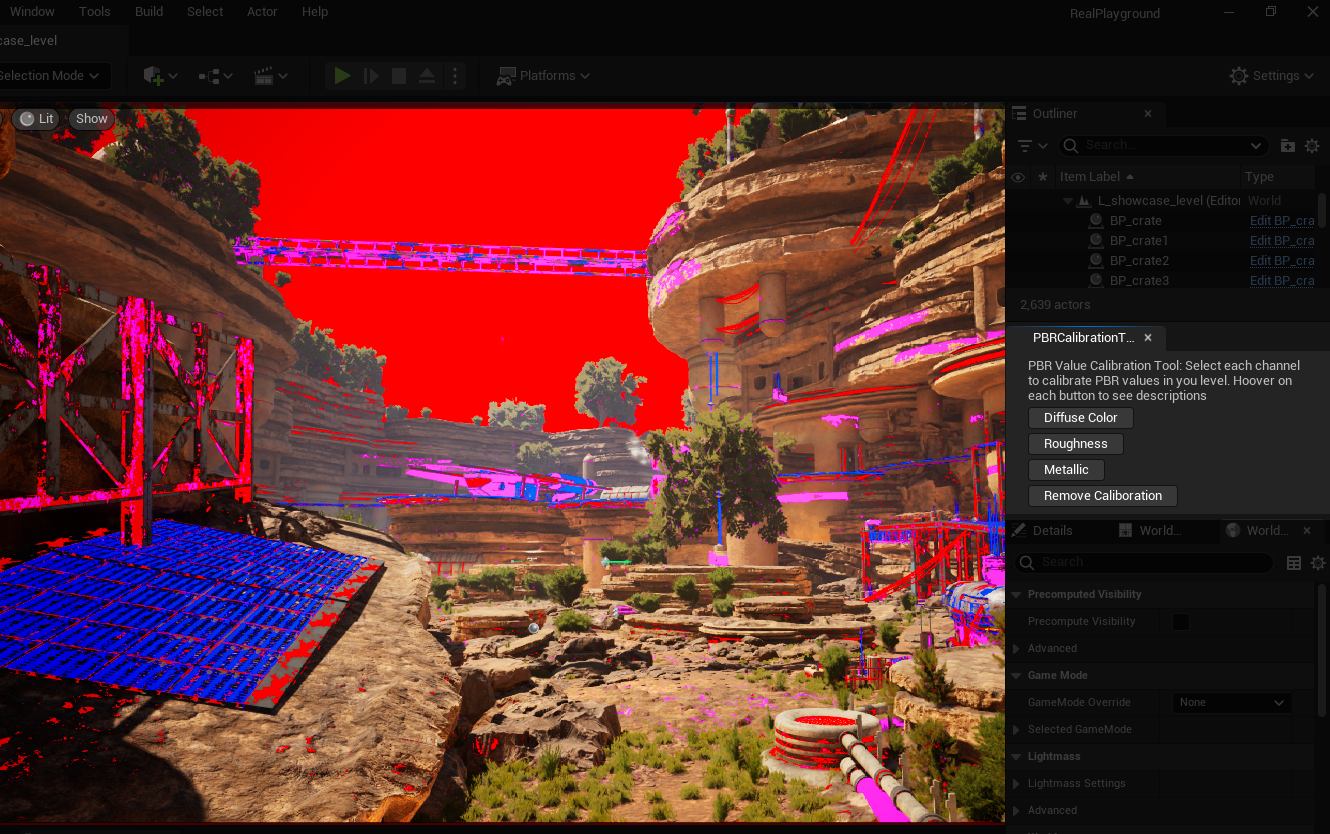
Below showing how the plugin works:


With Diffuse Color button, as what described in the button tooltip, those highlight color indicate:
RED: Diffuse Color is too dark for dielectric materials;
YELLOW: Diffuse Color is too bright for dielectric materials;
BLUE: Diffuse Color is too dark for metal materials;
MAGENTA: Diffuse Color is too saturated
With Roughness button, as what described in the button tooltip, those highlight color indicate:
RED: Roughness is lower than 0.098f;
YELLOW: Roughness is higher than 0.955f
With Metallic button, as what described in the button tooltip, those highlight color indicate:
RED: Metalness has a grayscale value (Invalid Range: 0.039f ~ 0.9216f)
I believe there are more things can be added into this calibration tool in the future such as texel density, vertices warning, texture format\size warning, material properties check, etc. It’s gonna be interesting to extand it into a more versatile tool.
