Unreal Calibration Plugin Part2
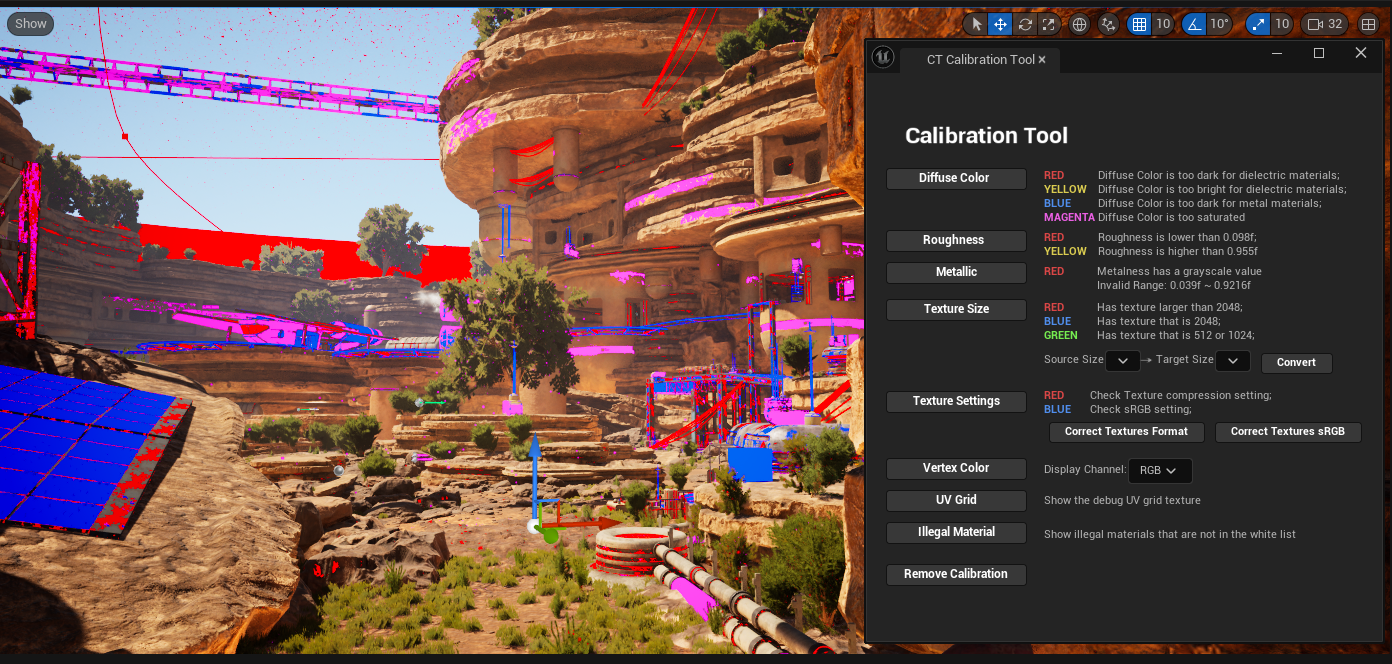
An unreal calibration plugin that can validate PBR values and texture sizes, check illegal materials, vertex color, uv grid in the current scene.
Unreal Calibration Plugin Part2
Extending From Last Post
In my last post, I extended the custom render pass and global shader into a PBR calibration tool: Unreal PBR Calibration Plugin There are more practical features that I can add to this tool to enhance its visualization capabilities and enable batch corrections. Therefore, I added:
- Check texture size and visualize;
- Resize textures from the source texture size to the target texture size.
- Check texture compression format and sRGB setting, and visualize them.
- Correct texture compression and sRGB settings based on the texture type.
- Display vertex color.
- Display UV grid debug texture.
- Check base materials that are not in the whitelist.
Python Or Blueprint
 I really like using Python for scripting tools. It’s been a while since I last wrote Python scripts for Unreal Engine. Back then, I remember there was a very limited Python API, and I wasn’t sure if there was any documentation available. The only resources I could find were some live recordings from Unreal’s official channels.
However this time, in this Unreal PBR Calibration Plugin page, I can almost find everything I need, it’s super clear and easy to search.
To use a python file in blueprint, it’s very simple: 
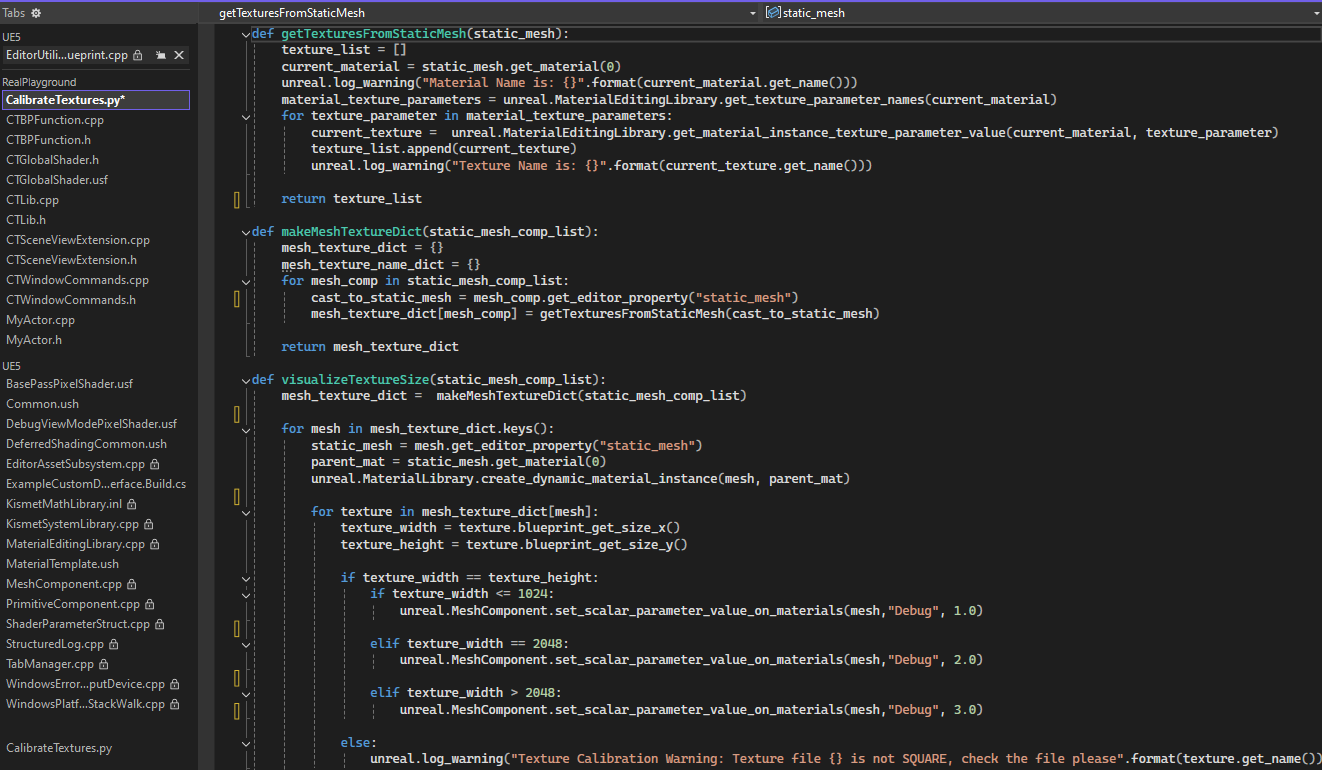
Firstly, I need to import the python file by using import sys, then an important step is to use importlib.reload function, otherwise the python function won’t execute except at the first time. Lastly, call the function from the python file.
Eventually, I didn’t use Python to make my tool. Compared with Blueprint, it is too slow, especially since I need to go through over 2000 components in the level with a lot of for-loop operations. Using Python, I sometimes even crashed. However, aside from this, Python in Unreal is super easy to learn and use. Almost all function names are the same as what is in Blueprint. For example, if I want to create a dynamic material instance, I just type it in and search for it in the documentation page: 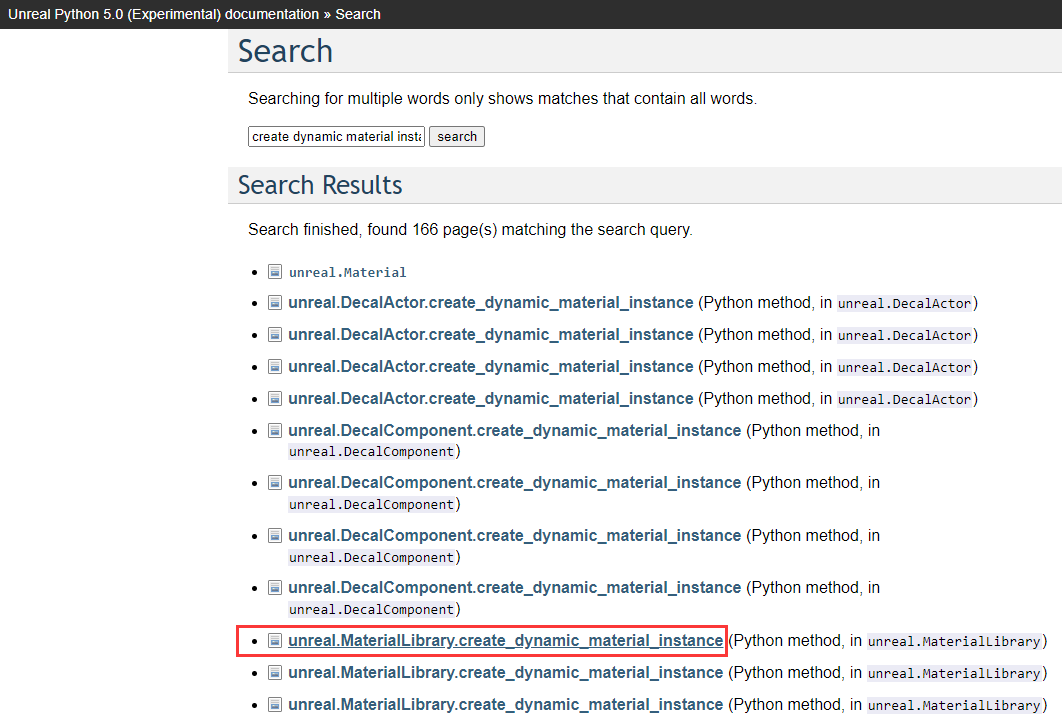
Copy the class name unreal.MaterialLibrary, and find out the parameters listed under the method explanation: 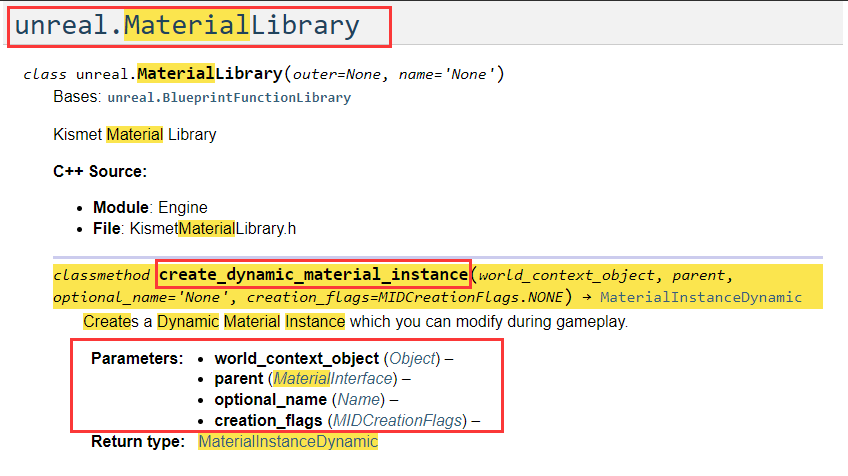
Blueprint can also fit almost everything I need for developing an editor tool, and it’s very fast. The best part about it is that you don’t need to be very familiar with Unreal’s huge C++ library or proficient in C++; you can still use it to build behaviors efficiently and quickly. Especially when it doesn’t need to be during runtime, although it’s definitely slower than C++, it’s still much faster than Python, its speed is sufficient for the user experience in terms of a not-run-time editor tool.
Make C++ Function to a Blueprint Node
As I choose to use blueprint to continue expanding my tool, I also need to convert those functions that I’ve already wrote in C++ to blueprint so that I can use them in my new blueprint graph.
Therefore in my C++ plugin folder, I created another two files:
 //..\Plugins\CTLib\Source\CTLib\Public\CTBPFunction.h
    #include "Kismet\BlueprintFunctionLibrary.h"
    #include "CoreMinimal.h"
    #include "CTBPFunction.generated.h" //*This include is necessary

    UCLASS()
    class CTLIB_API UCTLibFunctions : public UBlueprintFunctionLibrary  //*1
    {

        GENERATED_BODY()

    public:
        UFUNCTION(BlueprintCallable) //*2
        static void BPStartCalibrationAlbedo();
        ...

    private:
        static TSharedPtr<class FCTSceneViewExtension, ESPMode::ThreadSafe> CTSceneViewExtension; // Have to be static to save it
};CTLIB_APIis a must here, also theUinUCTLibFunctions- Mark it as
UFUNCTIONandBlueprintCallablemeans the method can be executed in Blueprints and the node has a execution pin. In Custom Blueprint Nodes: Exposing C++ to Blueprint with UFunction, there are a lot info on different node types.
   //..\Plugins\CTLib\Source\CTLib\Private\CTBPFunction.cpp
    #include "CTBPFunction.h"
    #include "CTSceneViewExtension.h"
    #include "CTLib.h"

    TSharedPtr<class FCTSceneViewExtension, ESPMode::ThreadSafe> UCTLibFunctions::CTSceneViewExtension = nullptr;

    void UCTLibFunctions::BPStartCalibrationAlbedo()
    {
        BPRemoveCalibration();
        if (CTSceneViewExtension == nullptr)
        {
            CTSceneViewExtension = FSceneViewExtensions::NewExtension<FCTSceneViewExtension>(0.0f, 0.0f);
        }
    }
    ...
    ...
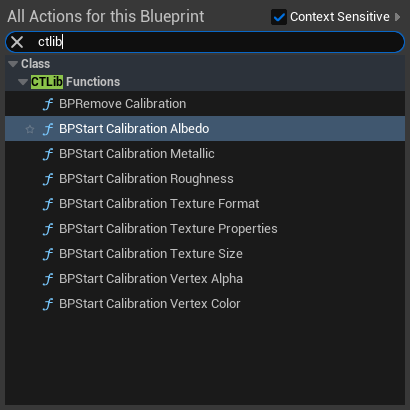
After compile the changes, I can find my functions in:
Unreal Editor Utility Widget
In the last post, I created the tool’s UI using Slate in C++. However, this is somewhat time-consuming and not very straightforward. Therefore, I implemented a new window with the Editor Utility Widget: 
The Editor Utility Widget is highly convenient in UE5, you can open the canvas through the ‘Designer’ button on the top right corner, in the designer mode, you can create texts, buttons, dropboxes from the Palette, and arrange them whithin the canvas. 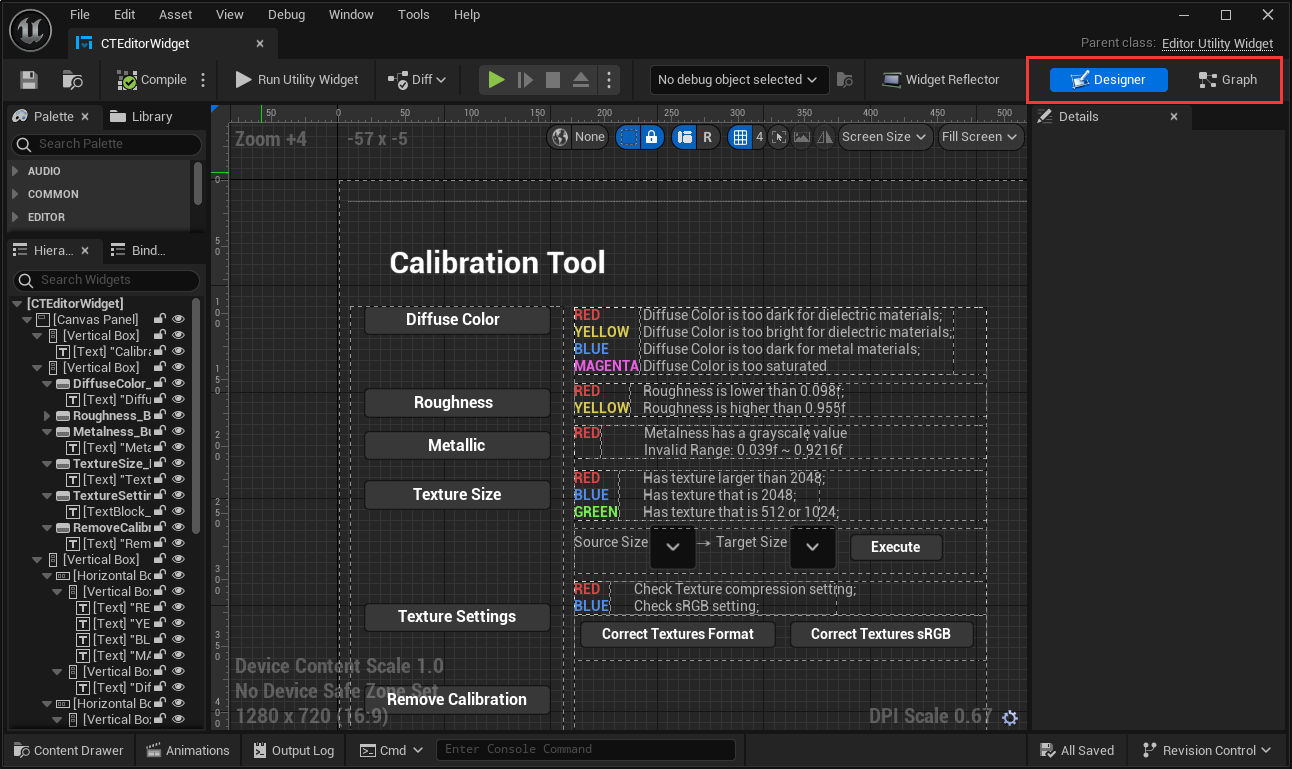
You can also directly switch to its blueprint by hit the ‘Graph’ button: 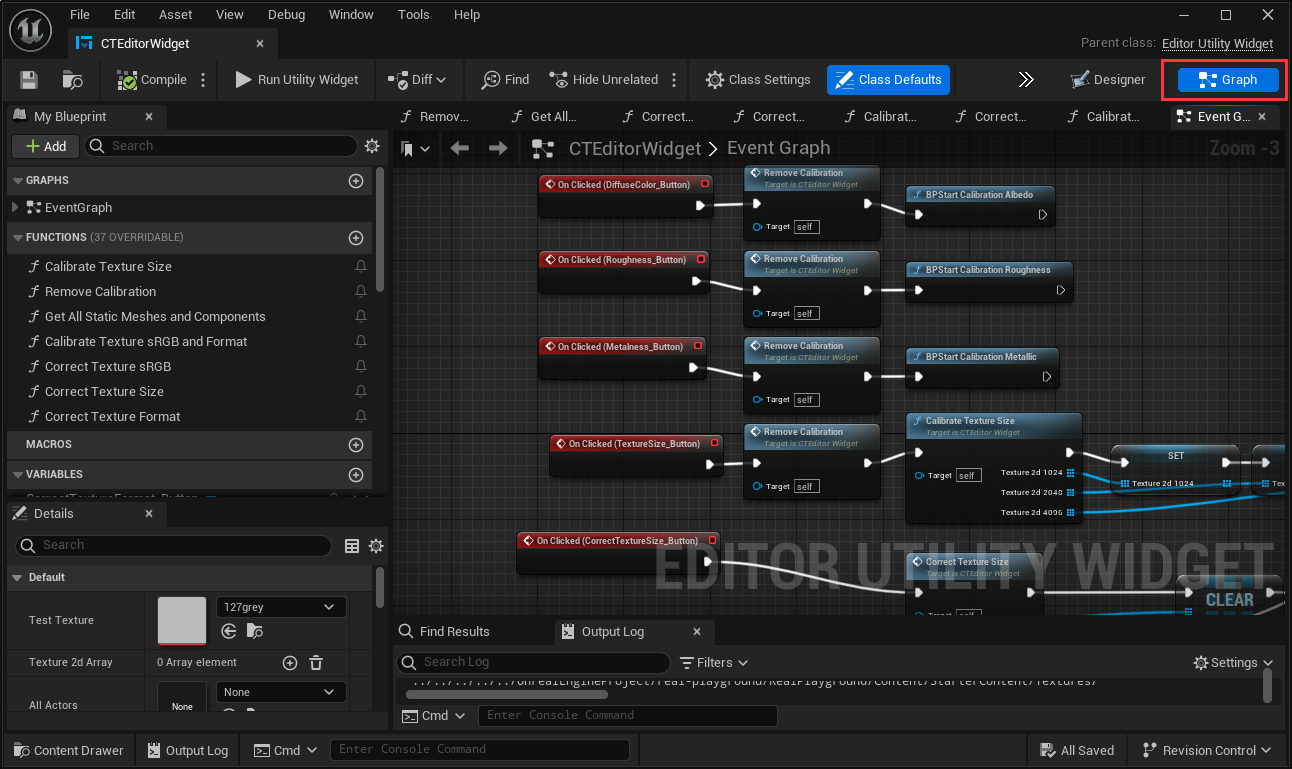
This is how my UI looks like from the last post: 
To extend my tool, I’d like to:
- Let users get the description easier, in stead of reading the long one line tooltip text;
- Add a new layout for new added features.
This is what I have eventually:
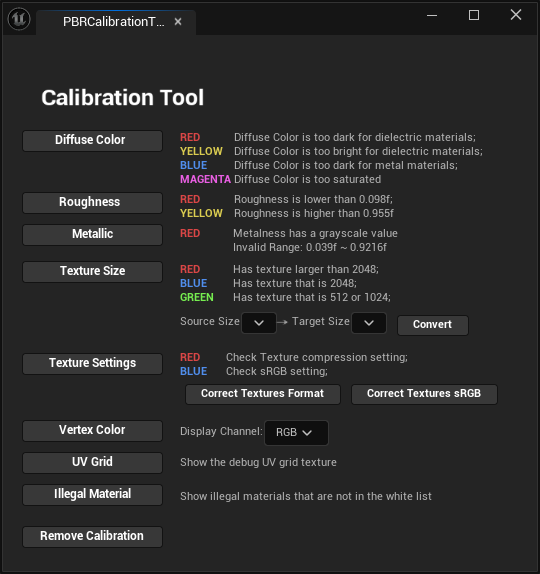
I’ll introduce each functionality in the following sections.
Texture Size Visualization and Calibration
For those PBR properties calibration, I get and compare the pixel data from the Gbuffer and visualize it through the global shader. However, the textures’ data on each material instance is not part of the Gbuffer data; they are per material/mesh information. Converting them into vertex information and visualizing pixel by pixel would be too much hassle and unnecessary. Therefore, I think the easiest way is to pass a flag into the material’s base color directly and then convert it in the global shader to override the pixels.
I think if I have time to optimize, the best approach here is to adding a new custom input in the material
Material Function
I created a material function with several dynamic switches to set x = 1, y = 1, or z = 1, so that I can use these value as flags in the global shader: 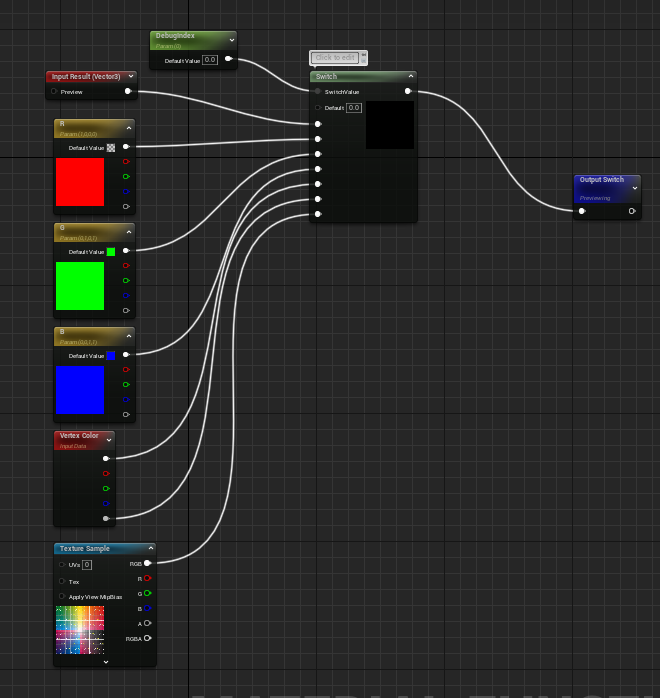
In Blueprint: Find All Textures and Batch Correction
To find all textures used in the level, I need to find all the materials used in the level, which is also all the actors or static meshes showing in the level. Therefore I used the node Get All Actors With Tag to find all actors that I want to check through. Then I can use Get Components by Class to find all the static mesh components. From static mesh component, I can get the static mesh from the static mesh component, then get the material source from the static mesh, then use Create Dynamic Material Instance to create DMI from the material source, then use it to get texture parameters or set material parameters. To get all textures of a material, it needs to find all the pamameter names in that material, so I need to iterate with Get Texture Parameter Names firstly then use Get Texture Parameter Value to get the individual texture 2d object. For each texture, I’ll check their sizes using <= 1024, == 2048, or > 2048. If any of the textures fall into the corresponding range, the mesh will be shaded with the designated warning color, ranging from red to blue or green accordingly.
Then output the result to my C++ function to call the global shader, this is what it looks like: 
After displaying the texture sizes, next I want to add a function to convert the textures from the selected source size to the selected target size. Therefore, I created two comboboxes to select sizes from 512 to 4k for each: 
For the function of resizing textures, I used the Set Editor Property node to set the MaxTextureSize of the source textures to the target size selected from the combobox: 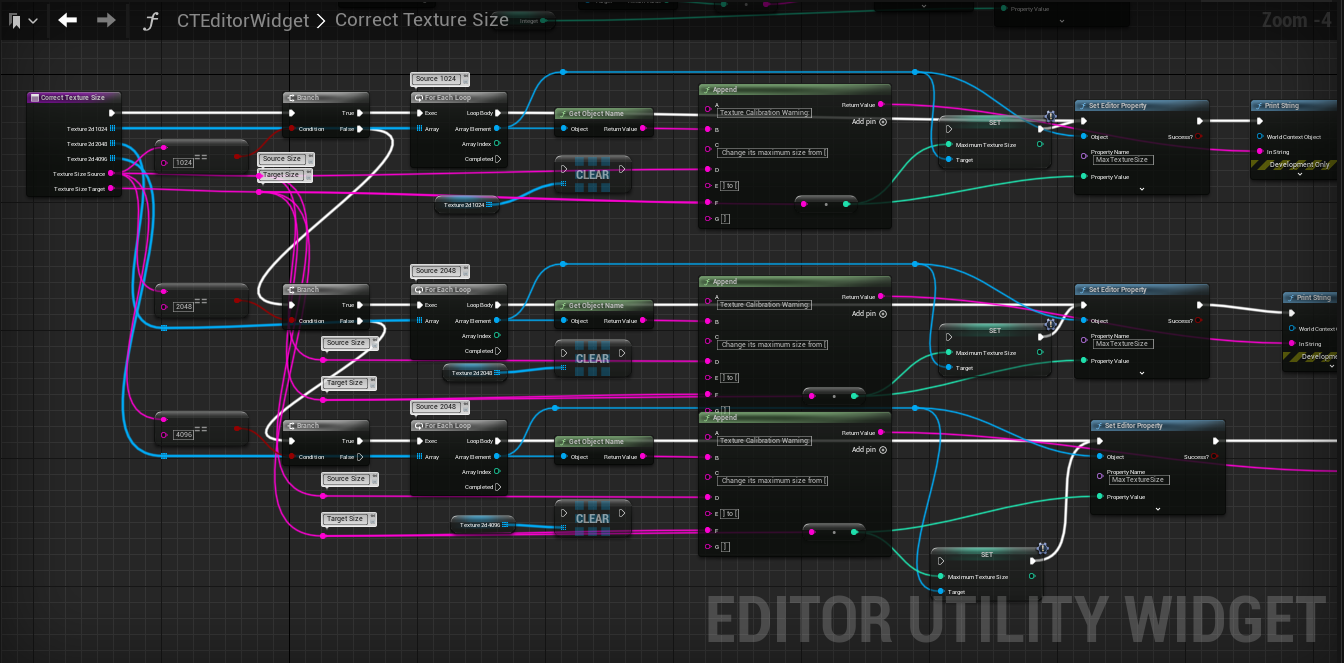
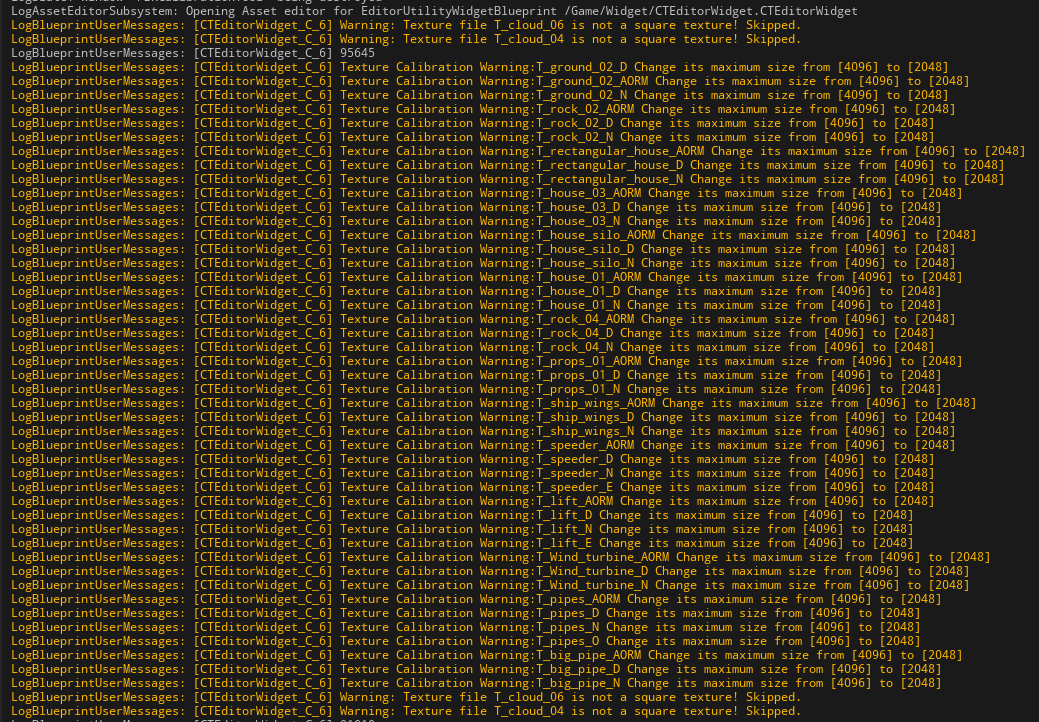
Here’s how it works, I converted all 4k textures (red) to 2k (blue), the tool will automatically update the calibration colors after conversion: 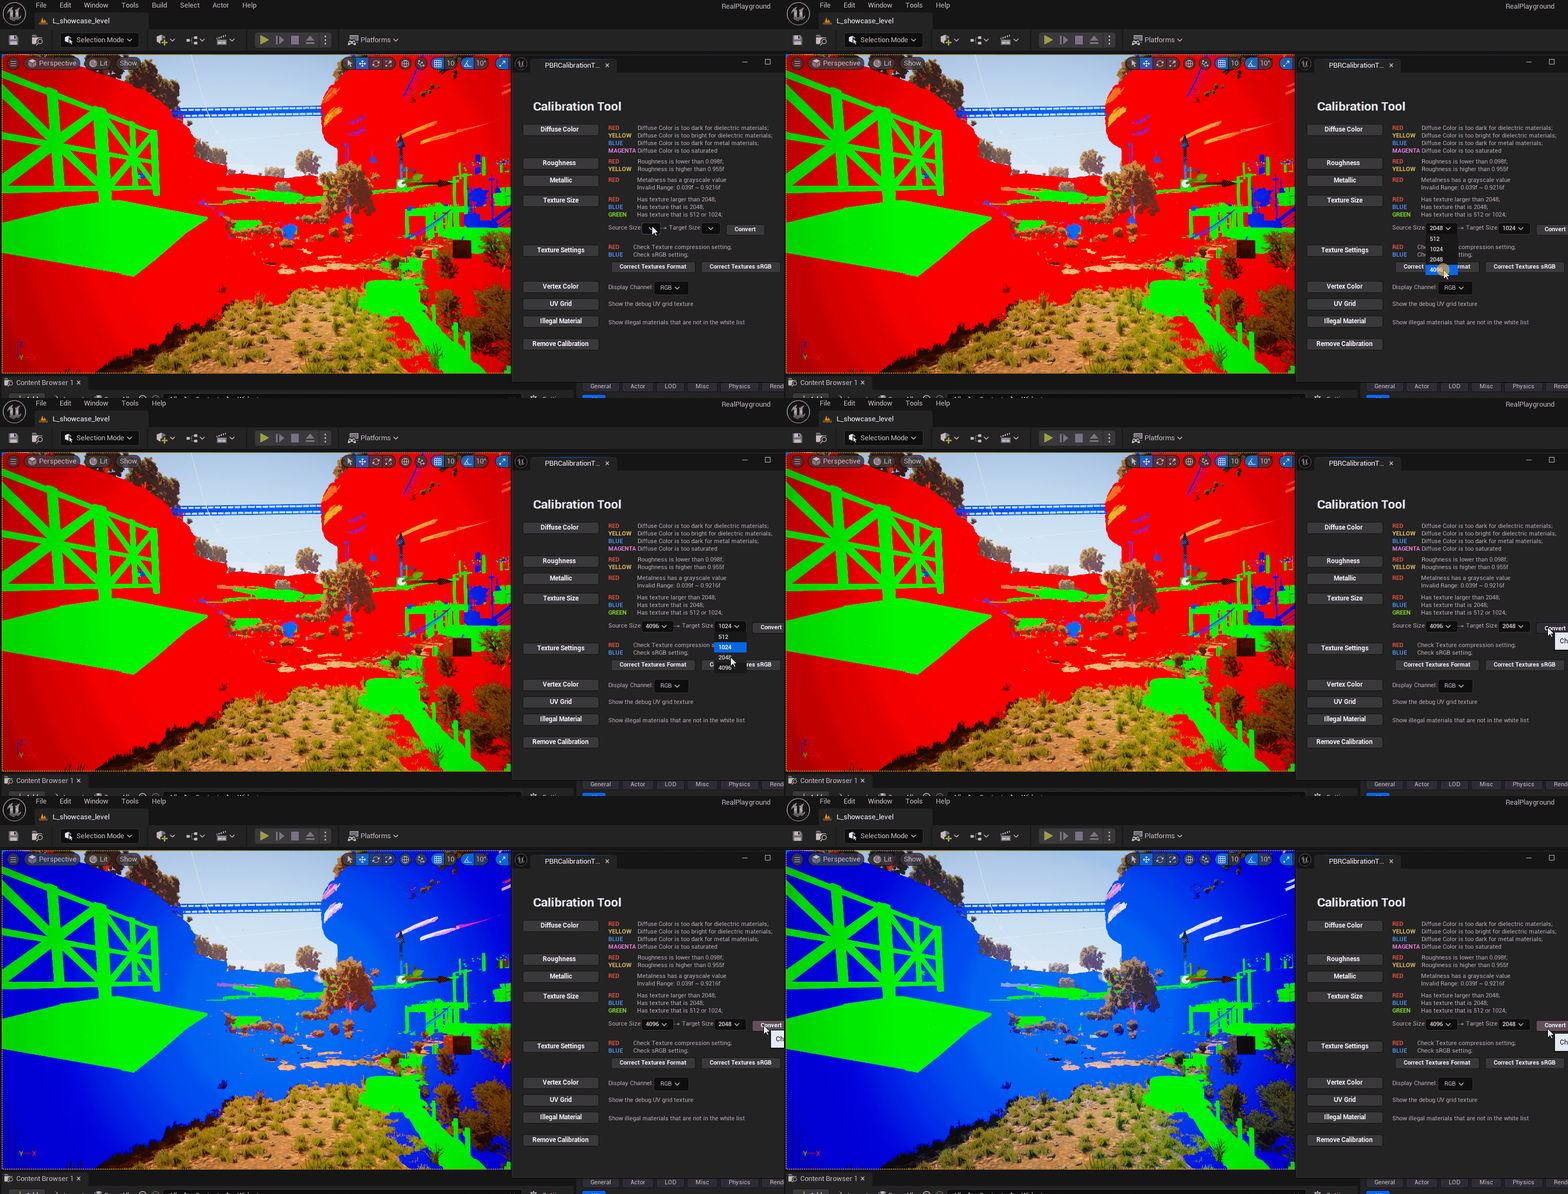 In the output log, the tool will provide messages indicating which textures have been converted:
Check Texture Format and sRGB Setting
The next feature I want to add to the calibration tool is the texture compression format and the sRGB settings. These two settings are very easy to mess up, and I’ve frequently reminded artists about this during several projects. There are always bugs caused by incorrect settings. For PBR materials, the roughness map, metalness map, and normal map should all be in linear color, while the diffuse map should be in sRGB. If the settings are incorrect, the visual result can be very different. For the texture compression format, except for the normal map, which should be BC7, the other maps should remain as default (DXT1/5, BC1/3).
Similar to the texture size calibration, I created a button and a function to visualize the problematic objects first, then provided two buttons to batch correct them to the correct settings. 
Because of the naming convention of textures (it’s important to establish a good naming convention from the start of a project, otherwise it’s going to be a nightmare for many people), I can easily identify the texture types from the name strings. 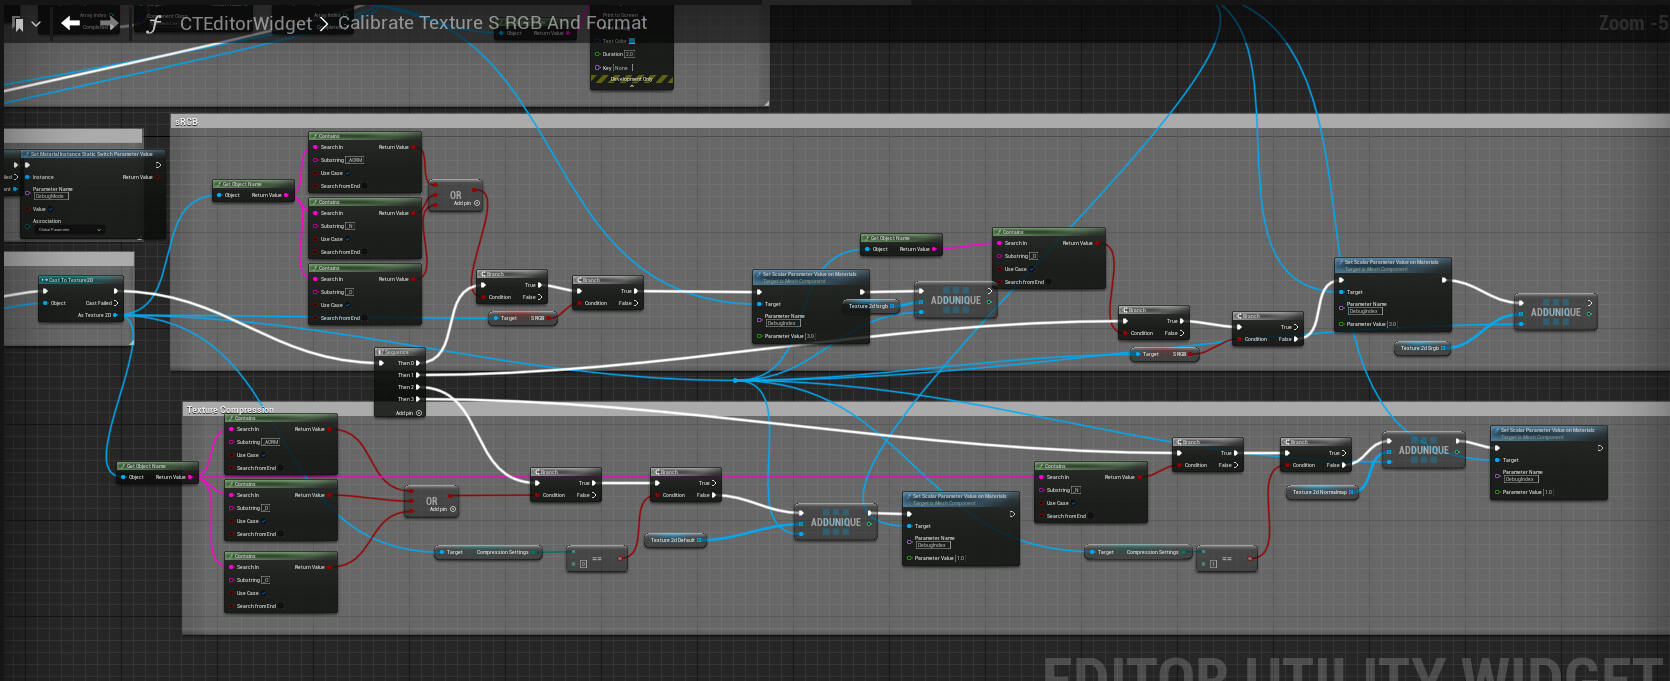
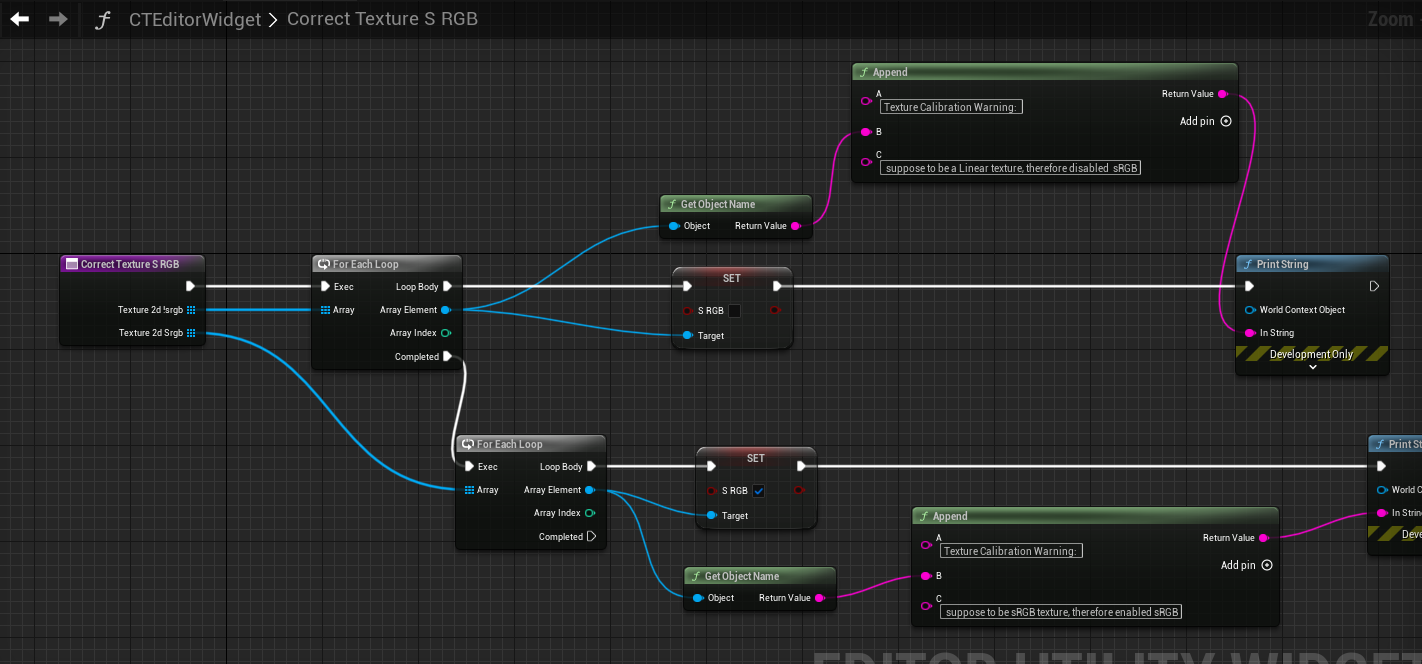
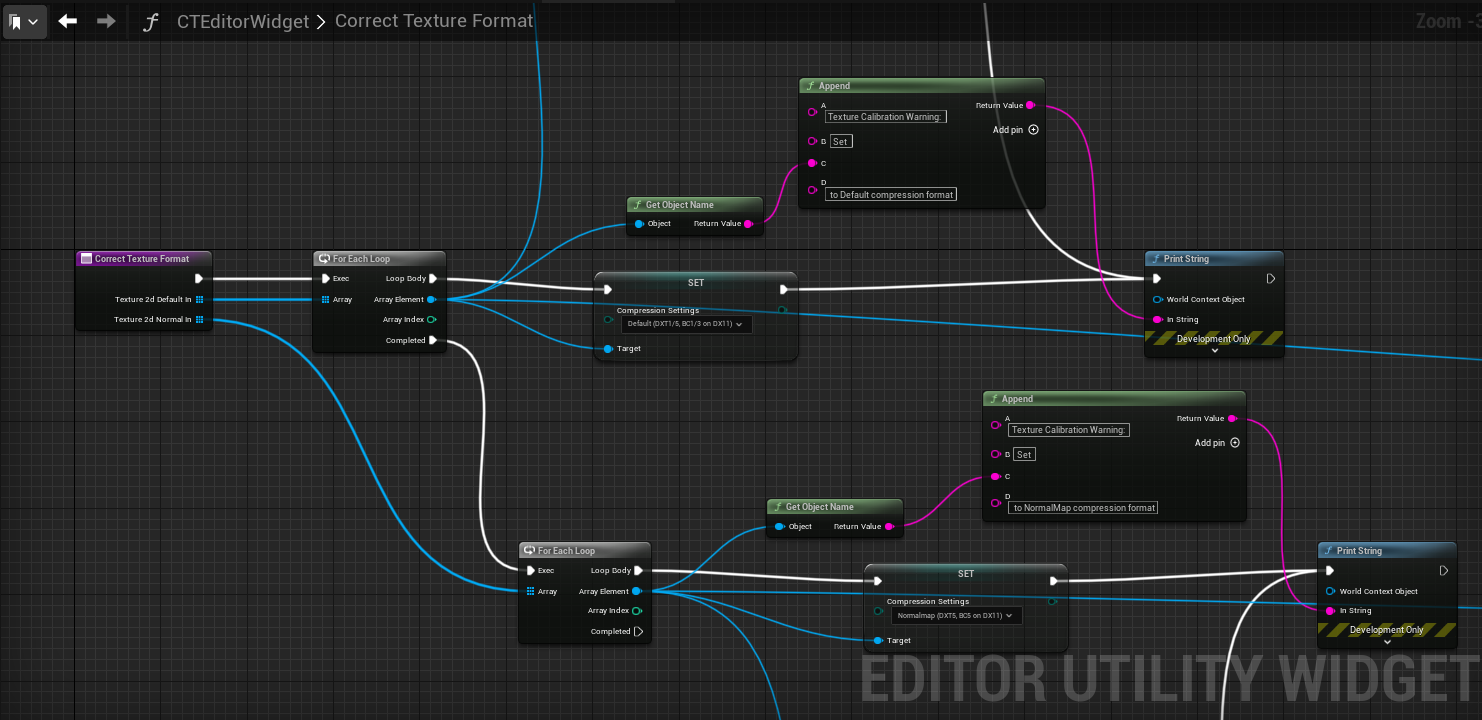
Here’s how it works:  Same, in the output log, the tool will provide messages indicating which textures have been fixed:
Show Vertex Color
Vertex color usage is very common, but there’s no quick debug overview for it. You have to either go to the mesh paint tool to display it or output the vertex color from the material editor. So, I added a button and a dropdown menu to display the vertex color’s RGB channels, Alpha channel, or R, G, B channels separately: 
The implementation is not complex. Essentially, for each combobox item, I output an index as a parameter to the C++ function, which then use the index as a flag to choose the corresponding vertex color channel. 
Show UV Grid Debug Texture
This function is very simple; it just outputs a UV grid texture so that I can use it to get an idea of the texel density and UV placement: 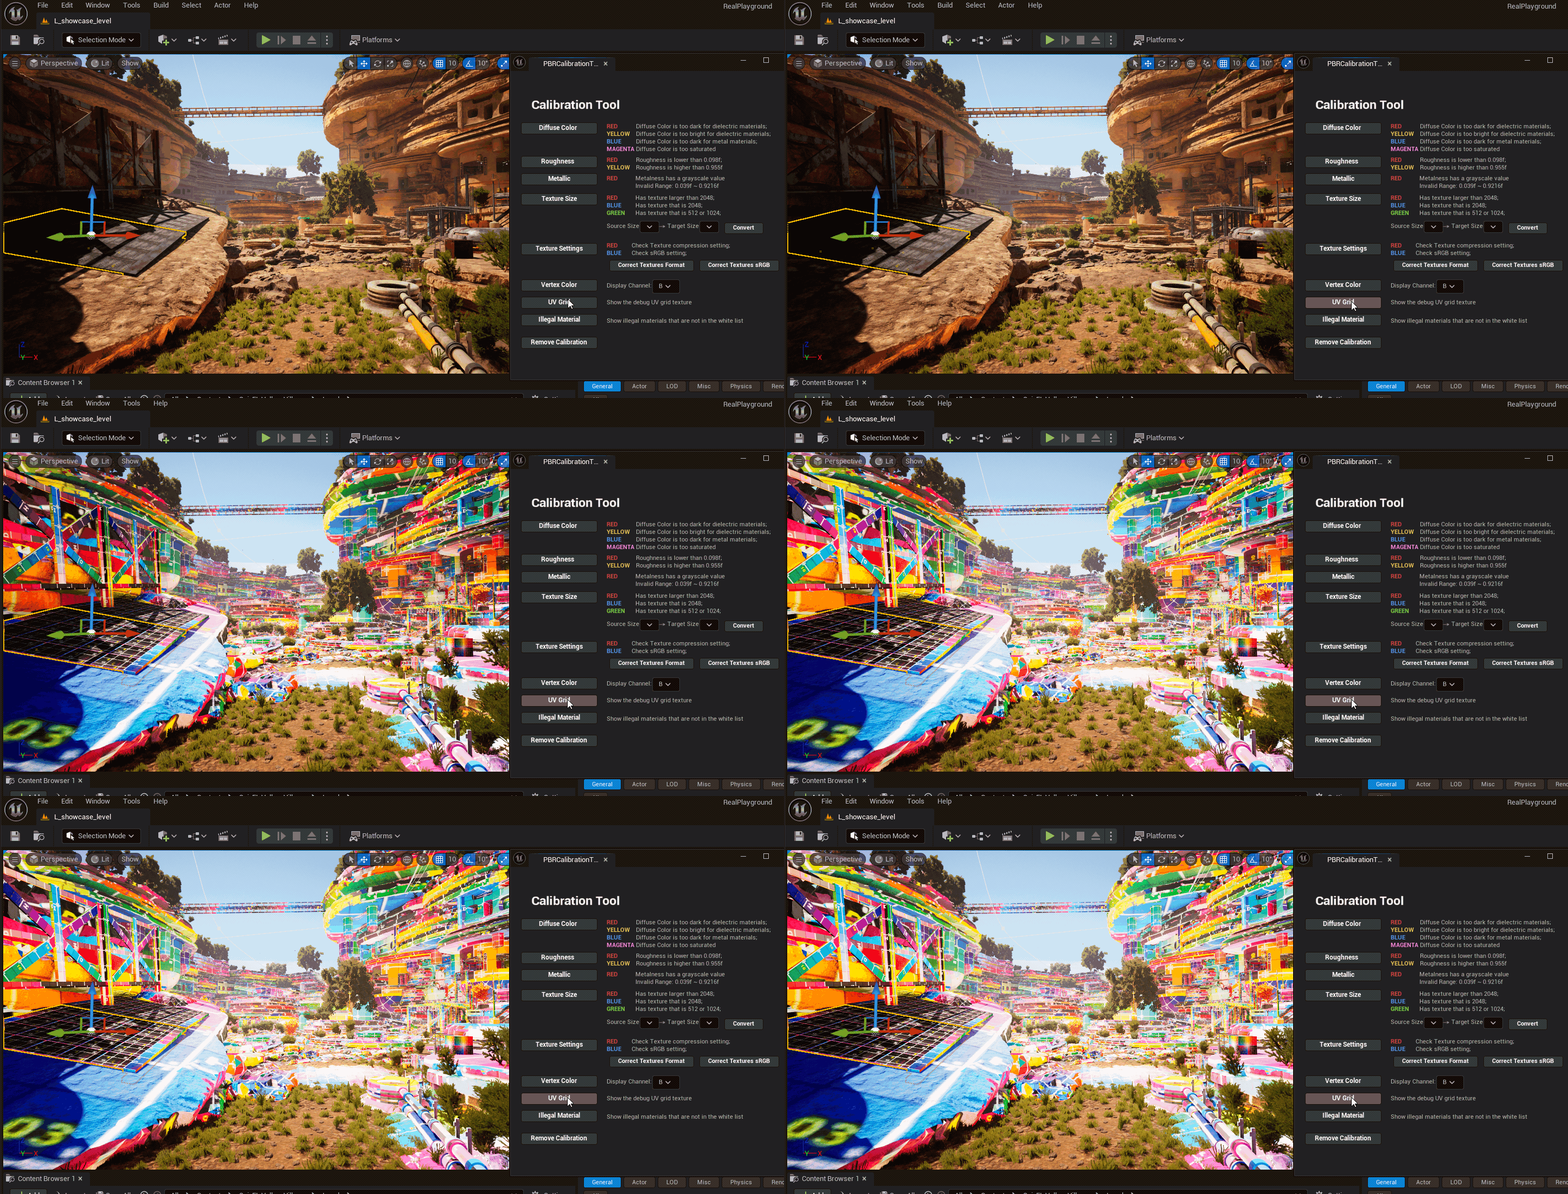
Check Invalid Base Materials
This is a feature I wish I had in my current project. Basically, I found some legacy shaders appearing in the current memory profiling but have no idea where and which asset is using them. The profiling tool only shows the shader’s name but does not display the name of the object. It would be easier if there were a visualization tool to display the problematic objects with incorrect base materials.
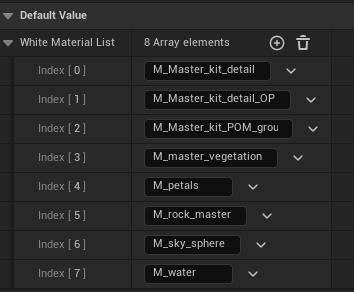
I created a string array to store the list of valid base materials:
The tool will then check each material in the scene to see if any material is not in the whitelist, and if so, it will be shaded red. 
Call Editor Utility Widget from C++
 The last thing I need to do is, in my last post I was using Slate to make the panel window in C++, and then implement the button under the Window menu directly.
Now since I’ve made the UI by Editor Utility Widget, I need to call this widget window from my C++ file so that I can still use the button in the menu to open the tool.
So in C++ file CTLib.cpp, I need to change FCTLibModule::OnSpawnPluginTab() from before to:
// ------------- CTLib.cpp -------------
TSharedRef<SDockTab> FCTLibModule::OnSpawnPluginTab(const FSpawnTabArgs& SpawnTabArgs)
{
	// Reference to the UtilityWidget
	UEditorUtilityWidgetBlueprint* myWidget = LoadObject<UEditorUtilityWidgetBlueprint>(nullptr, L"/Script/Blutility.EditorUtilityWidgetBlueprint'/Game/Widget/CTEditorWidget.CTEditorWidget'");

	TSharedRef<SDockTab> SpawnedTab = myWidget->SpawnEditorUITab(SpawnTabArgs);

	return SpawnedTab;
}
UEditorUtilityWidgetBlueprint is the class needs for loading a EditorUtilityWidget object.
