Shader Profiling And GPU Occupancy
Shader Profiling Tool
Recently I’ve been in the intense stage of the project, it is a point of time for profiling and optimizing shader (well I personally believe you should do this at the first place when you write the shader but the reality is I took those messed up shader from previous person who already left while ago and the work he left is not able to use, I have no choice but only can rewrite one in a short time frame).
Then this comes with the question I’ve had in my mind for a long time since I started to learn how to write shader - How exactly do you know if this shader is efficient or not, if it’s cost or not, and if it’s costly, how can I know which part is heavy? I know that I can capture a frame to no matter PIX or RenderDoc or whatever profiling tools, and look at the numbers to have a general idea about this mesh using this shader in this frame takes how many milliseconds, how many instructions, how many samplers, how many VGPR or SGPRs etc., but all of them are very vague and more importantly I can’t get a fast response, if I want to see the result of the shader on Xbox or PS5 I need to make a build of a scene and then take frame captures, it could take hours to wait for a build. I really want to know when I do math in shader, how exactly one line is more expensive or cheaper than another line, this is the specific step I’d like to know.
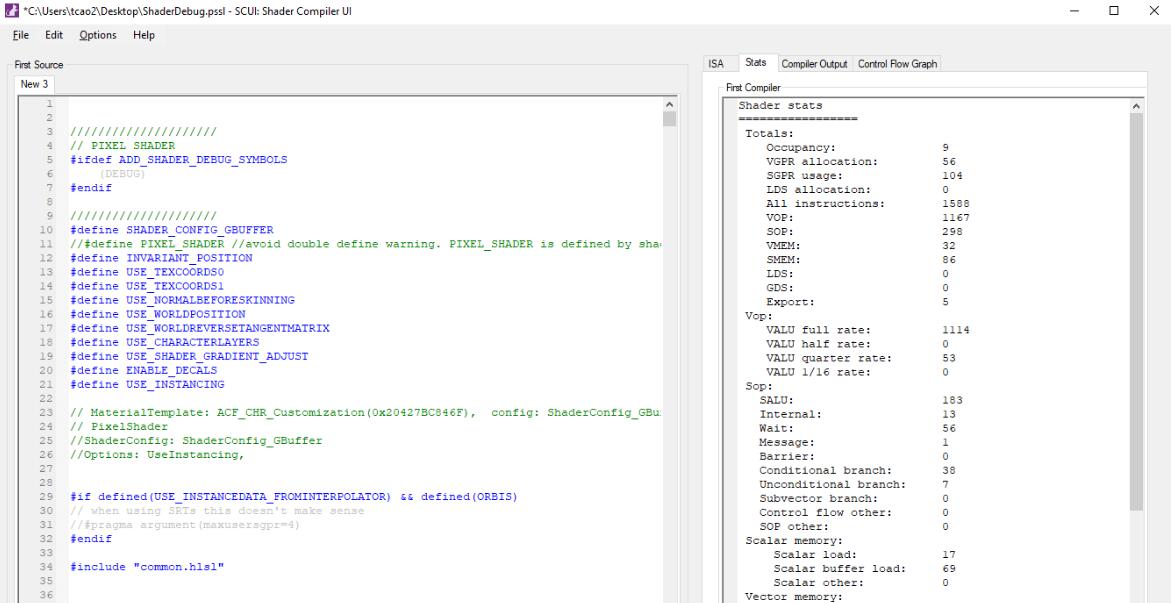
Well luckily I was introduced to a developer toolkit from PlayStation, it has a shader compiler tool that can reflect some information instantly without taking captures, that can allow me to profile from line to line in the hlsl file:
.png)
Not only the devkit from Playstation, but PIX also can show some info about how many VGPR for the shader picked, but may not able to change code directly in compiler and instantly get the stats:
.png)
VGPRs and Occupancy
The shader I need to optimize is a very big shader that it would be used for the current project I’m working on but also for the future projects. It is an outfit shader that support 16 surface types (cloth, leather, metal), 6 zone IDs (means it can use 1 RGB map to define 6 zones on 1 material to let each zone have its own behavior, for example I have 1 material for 1 outfit but it can be separated into cotton, hemp, leather, linen, iron and bronze, instead of using 6 materials to do so), also it has a pattern system for each zone to have different patterns from a pattern texture array, it also has weathering behaviors (blood, snow, dirt\mud, wetness..), and damage behaviors (wearing, tearing…). All of these demands make it hard to be not heavy, but there must be ways to optimize.
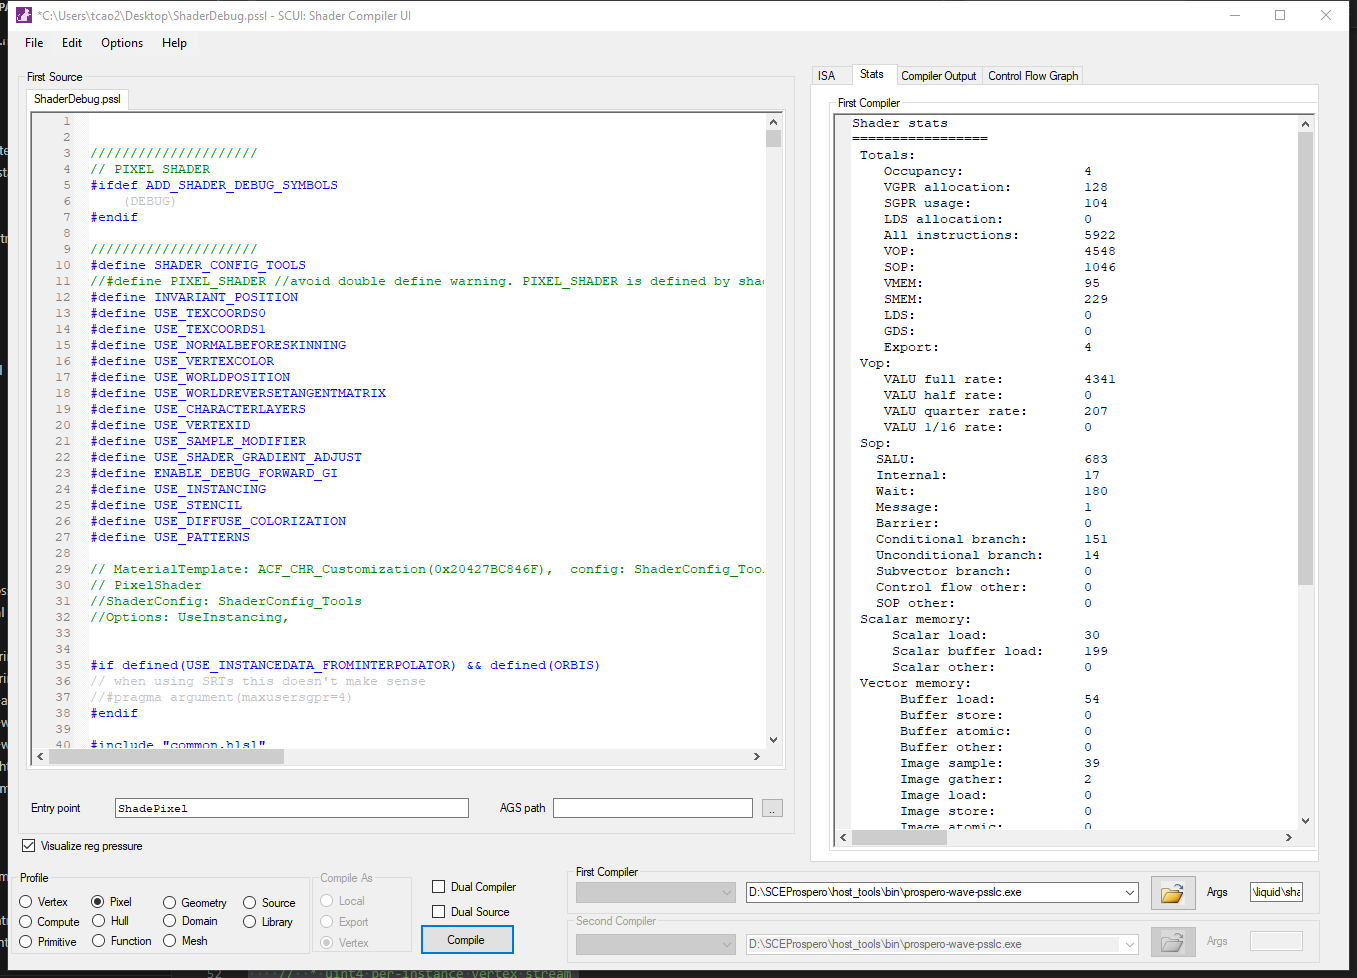
This is the stats before the optimization:

As you can see the VGPR is 128 and the occupancy is 4.
According to this VGPRs and Occupancy relationship chart, 128 is Occupancy 4, 20% wavefront, not good:
.png)
Firstly, the nice thing about this compiler is it can show where is the bottleneck with this shader:
.png)
This small V↑ icon identity the register pressure at which line.
Registers are expensive resource and compilers try their best to optimize the way local variables are assigned to hardware registers, which is manipulated by the ALU(Arithmetic Logic Units). CPUs are latency-oriented, designed to execute as many instructions from a single thread as possible. GPUs are throughput-oriented, designed to process parallel multiple tasks as much as possible.
Occupancy here means the maximum number of wavefronts that can potentially run on a Compute Unit at the same time. GPU prepares a buffer of batches in advance and assigns them to each of the Compute Units, how many batches the GPU can preassign depends on the number of vector general purpose registers (VGPRs) the shader needs. VGPRs are used to store data that is not uniform across the wavefront. While the Scalar General Purpose Registers (SGPRs) are used to store data that is uniform across the wavefront at compilation. Now you can see why it’s bad to have more VGPRs in the shader, and it leads to low occupancy rate (low number of wavefronts it can run on one CU).
Optimize My Shader
Reconstruct the Structure
So that in this screenshot, it shows the register pressure is at a line where I operate a branch:
.png)
which means the bottleneck is right here, I need to think how to optimize that branch. At this moment, the shader was in a structure layer by layer:
.png)
Basically each pink node is a custom code node that I will have an if-statement to see the pixel passing into this node, whether the pixels belong to the zone number or not, this is inorder to have each zone get its corresponding zone parameters like colors, roughness, surface ID, patterns, etc. This structure makes the if-statement repeat 6 times.
Then I was thinking maybe it’s not necessary to have that 6 times, maybe I can use float and vector arrays to branching parameters for each zone in one custom code. So I changed all parameters from every zone into one operator:
.png)
and use arrays and index to assign pixels into right zone, below are two examples:
.png)
.png)
Therefore the shader structure became like this:
.png)
After this restructure, I already got a big improve on the occupancy: .png)
The VGPR is 72 means the occupancy is 7 now.
The goal is to make the occupancy to 8 which is 40% wavefront for a shader like this with almost hundreds parameters. I need to reduce 8 more VGPR.
Well at this moment it was kind of difficult to reduce 8 at once from several lines of code. I tried bunch of things including:
- Reduced 3 float parameters from each zone (3*6=18 in total)
- Removed the if/else branch as much as possible. For example to use step(0.5, x) to have a zero or one flag and use this multiply with the two conditions.
- Try to make if branch into static switch (if x…) to (#if defined…).
- Changed all float4 colors to float3.
- Avoid math like sin(), cos(), pow()
- Avoid too many lerp when can use other simpler math
However those changes were kind of minor improvement to the VGPR, it decreased by 4 but still can’t reach 8 occupancy.
At this moment, the VGPR pressure is on the color vector input parameters:
.png)
In addition, because of the nature of GUP, it won’t help at all even if you delete a whole block from the other parts of shader, it’s not gonna make more wavefront available on one compute unit because the pressure of register is not there.
This means I need to reduce more color parameters exposed in the shader. Right now I have 1 albedo color picker and 3 pattern colors for each zone. It’s better not touch the albedo color pickers because it would cause troubles for assets we already have in the project. For the pattern colors I did a test to prove:
- I removed the 3*6 color pickers from the exposed properties.
- Replaced them with 3*6 integer indices:
.png)
- Add a predefined color float4 array in lib file:
.png)
- Then use those integer indices to reference the color the user chooses:
.png)
Using this method I can replace the 18 exposed color pickers (float4) to 18 indices (integer), this finally makes the occupancy to 8. Well, the loss is user experience, after the change the user needs to select color from index 0 to index 255 to get the color instead of choosing color directly in color pickers.
Use LUT and Write an LUT Generator
There’s still something can be optimized:
The predefined color list can be a predefined 256*256 LUT texture having 256 colors in total.
And it’s impossible to let me make this texture manually from Photoshop, it’s not accurate and I’m lazy.
So I wrote a cpp script to generate the color vectors into a texture with 4 columns and 64 colors in each:
.png)
(I used stb lib to write images)
.png)
This is gonna be easy for me to change any color or modify the sorting. Also it’s a color chart for users to reference where the color they want to use.
